

The characteristic curve, or engine curve, is a curve that represents the relationship between the effective power or the torque developed by the engine and the rotational speed of the crankshaft. Analysing the torque curve allows us to understand at which engine speed the car achieves the best filling of air/fuel mixture, which is what allows the highest possible torque to be developed. Analysing the power curve, on the other hand, shows how far and how quickly the engine is able to develop it. There is no single graph for each engine: at the same engine speed, a different load setting can lead to torque and power values that are lower than those recorded at full load. Load is defined according to the engine used: in a petrol engine the load is regulated by throttling the air/fuel mixture with the butterfly valve, while in a Diesel engine the load is regulated by metering the fuel through the injection pump. To put it simply, it relates to how far the accelerator pedal is pressed. The full-load graph is usually the one taken into consideration, since it shows the engine at its limit conditions.
Petrol Engines
Let us take as an example the characteristic curve of a four-cylinder, four-stroke petrol engine (Pe: effective power, Me: torque):
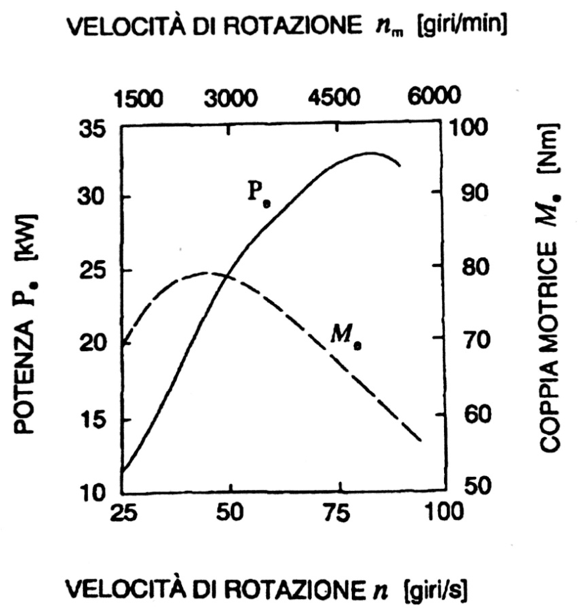
The curves take this shape because of the quality of the mixture filling in the combustion chamber. At low engine speeds part of the mixture has time to flow back out of the cylinder through the intake valve, worsening the quality of combustion. The torque curve also falls at high engine speeds because sonic conditions are reached: no further mass flow can be drawn in (and ever higher speeds would require more of it) because of choked flow, a fluid-dynamic condition that prevents any further increase in the speed of the fluid and, consequently, in the mass flow (which is linked to the cross-sectional area and to the speed of the fluid). The power curve keeps rising even after the peak of the torque curve, albeit less steeply than before, since the engine speed reached compensates for the drop in torque. The power curve has a maximum of its own too, because torque that is by then too low, together with the friction losses of the mechanical components, no longer allows useful energy to be developed for the running of the engine.
Diesel Engines
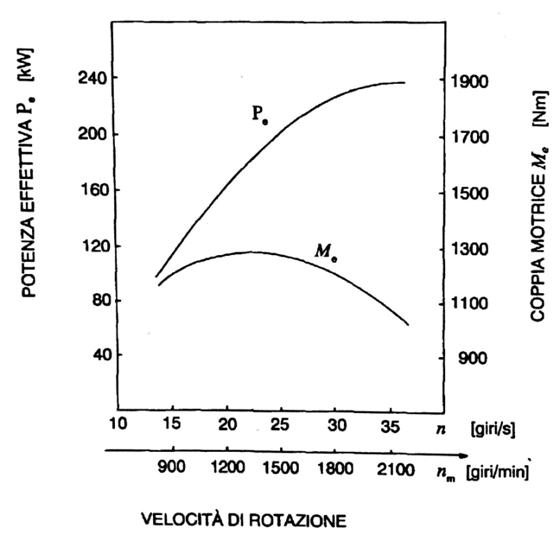
And what about the Diesel engine? It is still a combustion engine, so its curve behaves in a similar way to that of the petrol engine. In a Diesel engine the torque curve stays flatter. This is due to the fact that the degree of cylinder filling remains more constant as engine speed varies. It can also be seen that maximum power is lower, since combustion takes place more slowly and the components making up the crank mechanism (pistons, connecting rods, and so on) are heavier. Let us now look at the characteristic curve of a six-cylinder, four-stroke Diesel engine (Pe: effective power, Me: torque):
Reading characteristic curves is not limited to identifying the maximum values shown on the graph. Identifying the engine speed interval between the maximum torque and maximum power values makes it possible to assess how flexible the engine is. The flexibility of an engine means its ability to make up for the loss of power caused by an increase in external resistance (for example, moving from a flat road to an uphill one) with an increase in torque. The wider the engine speed interval between the two maxima, the more flexible (or, more properly, the more stable) the engine is, in other words the more it is able to keep the vehicle moving without the need to change down. Let us compare three engines with different degrees of flexibility.
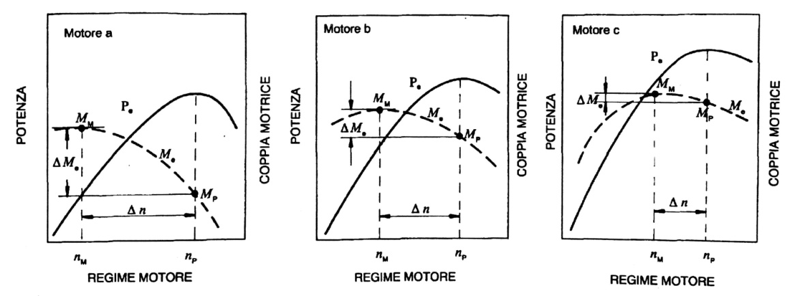
In the graph on the left, the wide ∆n interval allows Engine A to be flexible, helping to keep the car moving even when resistance to motion is high. This makes it possible to use gearboxes with few ratios, operating characteristics that suit a city car well, since the driver can concentrate on driving in urban traffic, made up of frequent slowing down and picking up again. As that interval narrows, the engine becomes more powerful, but also less flexible (or increasingly rigid). This forces the driver to change down in order to keep the vehicle moving and calls for gearboxes with a greater number of ratios. That is why, in order to reach higher power outputs, sports cars use rigid engines and are characterised by a high number of gears.